The PASS Business Analytics Conference (PASS BAC) is PASS‘ first foray into an event that is dedicated to business intelligence, big data, data visualization, and business analytics. And it totally makes sense for PASS to move in this direction, over and above the flagship community work centered on database management and application development. Why? Because business analytics is all about how to apply the data being collected and managed by all of those developers and DBAs. And, at the end of the day, how we use and apply our data is really the nexus of its value. That’s what matters to business. You can read the speech from the standing president, Bill Graziano (Twitter | Blog), or watch it online at the PASS website.

The day one highlight, introduced by the SQL Server team’s best presenter – Amir Netz (Twitter), is the release of a new BI data visualization tool called Project “GeoFlow” for Excel. GeoFlow is a 3D visualization and storytelling tool that helps you map, explore and interact with both geographic and chronological data for visualizing data which is difficult to identify in traditional 2D tables and charts. With GeoFlow, you can plot up to a million rows of data in 3D on Bing Maps, see data changes over time and share findings through appealing screenshots and cinematic, guided video tours of the data. It’s really something you have to see to understand – check out the video demo and screenshots below. You can also download and try it out firsthand today. It’s an entirely new way to experience and share insights – one you’ll probably enjoy. For more information on GeoFlow, check out the Excel team’s blog and visit the BI website.

The highlight for me, aside from connecting with so many friends and colleagues in the exhibit hall at the SQL Sentry booth, was the day 2 keynote address by Dr. Steve Levitt of Freakonomics fame. Freakonomics is both a brilliant blog and the number one business book in America. His insights are well documented in a variety of places, not just in his own channels, but also in places such as TEDtalks. I’m also really enjoying his new website, https://www.freakonomicsexperiments.com/.
Steve presented an outstanding keynote, full of funny anecdotes and insights into the world of data analytics and interpretation. A couple of his comments really resonated with me which are worth repeating. In one story, he pointed out how some of the greatest insights came from corporate data which was collected incidentally or coincidentally. The data that help provide the greatest and most valuable revelations were from data that was basically a corporate afterthought. Another revelation – he’s only now starting to make much use of relational databases. He primarily uses spreadsheets, flat files, and the Stata statistical analysis tool. Another insight, which I’ve known and proselytized as “the Fresh Pair of Eyes” approach, is that it really helps him to gain insights in a problem by knowing as little about the problem as possible. As it turns out, if you know the industry or the challenge at the core of the problem, you make a lot of assumptions that limit your means of interpreting data. By knowing nothing or next to nothing about a particular problem, you can ask the questions that insiders never ask. Here’s an example (not from the keynote though) – let’s say you’re an energy company CEO. You might spend a lot of time thinking about how to accommodate the expected huge increase in energy consumption due to lots of people driving electric cars. You might tell your data analysts to figure out when and how to ensure peak electrical usage is available at the times when consumers are recharging their electric vehicles. But a fresh pair of eyes would point out that electric cars, in their present form, are a huge energy boondoggle compared to hybrid and plain ol’ cheap, high-mileage models like the Honda Civic. Consumers will never recoup their investment in a high-priced, all-electric car compared to a cheap, gas sipping model.
 At the heart of his presentation is the fact that data is meaningless when it doesn’t answer important questions! Many times, data professionals spend so much time devising elegant SQL statements and clever user-interfaces that they forget about using a fresh pair of eyes when they look at business questions. Our session, Operational Excellence for the BI Pro, focused on the trails and travails of successfully implementing and growing the footprint of a business intelligence project.
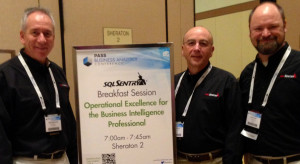
In addition, we had a fun and very informative panel discussion breakfast on Thursday of the PASS BAC. At right is a picture of Nick Harshbarger, Justin Randal, and me prior to the session. The audience was very engaged and, despite having no slides, there was a whole lot of wisdom goin’ on. The panel included Chris Webb (Twitter | Blog), Craig Utley, Jen Stirrup (Twitter | Blog), Paul Turley (Blog), and Stacia Misner (Twitter | Blog). I served as the moderator and facilitator of the session. We recorded the session, with a little HD Flip camera, and although I haven’t checked out the file yet, we’re hopeful we can post it or at least a transcript soon.
Do you have a “fresh eyes” story? I’d love to hear it! Post a comment here!
Many thanks,
-Kevin


Speak Your Mind